Researchers conducted a follow-up analysis of a large clinical trial to investigate how variations in NAD+ response to NMN supplementation affect study outcomes.
“This is the first study that describes the relationship between blood NAD concentration and a functional outcome parameter.”
Key Points:
The analysis revealed several important findings:
- Large variability in individual blood NAD+ response to NMN supplementation was observed
- A ~15 nmol/L NAD+ increase was needed to achieve notable improvements in the walking test and quality of life score
- Closely tracking individual NAD+ responses is crucial for assessing efficacy and personalizing regimens to achieve optimal results
Effect of NAD+ Variability on Clinical Trial Results Evaluated in Follow-Up Analysis
The data analyzed in this study came from a previously published double-blind, randomized clinical trial.
Healthy adults (40-65 years) were randomized into 4 groups and received their respective treatments for 60 days:
- Placebo
- NMN (300 mg/day)
- NMN (600 mg/day)
- NMN (900 mg/day)
Study measurements:
- Baseline & 60 days: Age, sex, BMI, blood biological age (calculated by Aging.AI 3.0) and HOMA-IR
- Baseline, 30 days, & 60 days: Blood NAD concentration, 6-minute walk test, and 36-item short-form survey (SF-36) scores
Wide Variation in Individual Blood NAD+ Response to NMN
The study found that NMN supplementation (300, 600, 900 mg/day) effectively increased NAD+ levels in participants at 30 and 60 days.
However, NMN’s effect on blood NAD+ levels varied greatly between individuals.
The coefficient of variation (CV, a measure of variability) ranged from 29.2% to 113.3% in the treatment groups.
“Blood NAD concentration changes are dose-dependent but exhibit high interindividual variability.”
Change in NAD+ Levels Linked to Better Outcome Improvements
Larger increases in NAD+ levels were associated with better improvements in the quality of life assessment score (SF-36) and the 6-minute walking test at days 30 and 60.
- Walking test, day 30: For each 1 nmol/L increase in NAD, participants walked 1.37 meters more than baseline test
- Quality of life score, day 30: An increase of 5 nmol/L in NAD was associated with a 5.76 point increase
The improvements associated with higher NAD+ changes were even more noticeable after 60 days.
“Blood NAD concentrations should be measured during NMN supplementation.”
Size of NAD+ Boost for Improved Walking and Quality of Life Identified
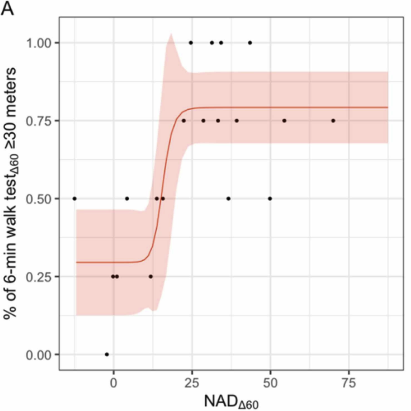
The researchers determined that an increase in NAD levels (NADΔ) of 15.7 and 13.5 nmol/L yielded noticeable improvements in the 6-minute walk test and quality of life score, respectively.
The graph below illustrates how the change in blood NAD+ levels (NADΔ) is related to improvements in walking distance (defined as an increase of at least 30 meters from the baseline walking test).

Walking Test and NADΔ
Black dots show the percentage of people that walked 30 meters farther in a walking test.
As NADΔ increases (moving right along the chart), the percentage of people achieving this improvement (black dots) also increases.
The red line shows this trend – higher increases in NAD+ levels are strongly associated with better walking performance.
Higher NADΔ were associated with improvements in 6-minute walk test distance and SF-36 scores and NADΔ ≈ 15 nmol/L produced a clinically significant improvement in these outcomes.
Improving Outcomes by Measuring Individual NAD+ Variability
NAD+ levels vary widely among people (1, 2, 3).
Factors such as age, gender, genetics, gut microbiome, health status, and lifestyle can influence baseline NAD+ levels and response to supplementation (4, 5, 6, 7, 8, 9)
When evaluating NMN dosage in this study, 300 mg did not affect the walking test or quality of life scores, possibly due to high variability of blood NAD+ responses.
“The lack of association in the 300 mg group may be due to the large variation in blood NAD response to NMN supplementation, especially in a lower dose.”
This follow-up analysis found that changes in NAD+ levels were significantly linked to improvements in the walking test or quality of life scores, regardless of dosage, indicating that individual NAD+ changes are important for assessing NMN’s efficacy.
“The efficacy of NMN supplementation should not only be assessed through the dosage of NMN administrated but also on the individual’s actual NAD response.”
These results are consistent with other studies that observed a link between individual variability in response and study outcomes (7, 10).
“By closely monitoring changes in blood NAD concentration, a personalized dosage can be administered, aiming to achieve optimal effects at the individual level.”
Conclusion
Researchers observed high variability in the blood NAD+ response to NMN supplementation among individuals.
Analysis of NAD+ level changes following NMN supplementation revealed a threshold level of NAD+ increase required for significant improvements in quality of life scores and walking test performance.
“The increase in blood NAD concentrations after NMN supplementation has a high interindividual variability and a higher NAD increase is associated with better functional outcomes and quality of life.”
Tracking individual NAD+ responses to supplementation enables both personalized approaches and deeper understanding of NAD+ levels’ impact on health outcomes.
“Because of the high interindividual variability of the NADΔ after NMN supplementation, monitoring NAD concentration can provide valuable insights for tailoring personalized dosage regimens and optimizing NMN utilization.”
“Further studies on personalized NAD precursor supplements and optimal blood NAD concentration are warranted.”
